

Mumbai real estate realisation and asking price have quietly stopped being the same number in 2026. Your sheet carries one price. Your bank account will see another — and the distance between them is where margins are going this year.
A developer in Borivali West told me his sale price without pausing. Thirty-two thousand a square foot. He had checked three portals, called two brokers, and pulled the last four registrations on his own lane.
He was right.
He was also going to be wrong by about two thousand rupees a foot — not because the market rate was wrong, but because the market rate and the money that reaches him have stopped being the same number.
The Instinct Is Not the Problem
For twenty years in this city, the printed price was the real price. You found the rate, you added your bit for a corner flat or a better elevation, and that is what landed in the account. Discounts existed. They were small, and slightly embarrassing.
A builder who knew his own lane better than any consultant could underwrite a project in the time it took to walk the plot. That instinct built most of the firms operating in the western suburbs today, and it deserves considerably more respect than a spreadsheet usually gives it.
What changed is not the instinct. It is what sits underneath the printed number.
Four Things That Moved at the Same Time — and What They Mean for Realisation
Mumbai is not in a crisis. It is in a structural shift — and four data points arrived at the same time to produce it.
1. India launched more homes than it sold in H1 2026. Across eight major cities, developers introduced 187,350 new units in the first half of 2026 against 171,471 units sold — a gap of over 15,800 units in a single half-year. Mumbai specifically recorded an 8% rise in new launches while sales grew just 1% year-on-year. The city now carries 1,57,410 unsold units — the largest unsold inventory of any city in India — with a Quarters-to-Sell ratio of 6.5 quarters (approximately 19–20 months at current absorption pace).
2. This pattern has run nationally every year since 2022. Supply has outpaced absorption for three consecutive years. What was a temporary post-pandemic inventory flush has become a structural condition. Developers have not blinked on headline prices. The adjustment is happening below the line.
3. The rate cycle stopped helping. The RBI cut the repo rate to 5.25% in December 2025 — its first cut in over a year — and has held it there through the June 2026 MPC meeting. The stimulus from rate movement that supported sales velocity in 2023 and 2024 is no longer available as a tailwind.
4. The buyer pool narrowed — and concentrated upward. Homes priced above ₹1 crore accounted for 54% of total residential sales in H1 2026, up from 49% a year earlier. This is not a demand signal for the premium segment. It is partly a price signal — entry-level and mid-market buyers are being priced out of their segment, while developers continue launching into the price band where competition is thickest.
Any one of those is survivable. Together they change a single thing: who has to move first in a negotiation. When there were more buyers than towers, the buyer moved. Across most of the suburbs, that is no longer reliably true.
What a Developer Does When He Cannot Cut the Price
Here is the part that does not appear in any price index.
Almost nobody in Mumbai is cutting headline rates right now. A sticker-price cut is public. It reprices your entire unsold stock overnight, it enrages everyone who booked last quarter, and it tells your lender something you would rather not say out loud. So the rate on the hoarding holds.
The concession moves somewhere quieter instead. Stamp duty absorbed. Floor rise waived. A payment plan where the buyer pays almost nothing until possession and you carry the cost of the wait. A fatter commission to the channel partner who actually walks the buyer through the door.
Knight Frank’s India Real Estate H1 2026 report states this directly: developers have broadly resisted formal price reductions, preferring demand-side incentives including flexible payment plans, subvention schemes, stamp duty waivers, and enhanced channel partner commissions. Headline and effective transaction prices can diverge materially when incentive intensity is high — and reported price appreciation can overstate what buyers are actually gaining.
Read that from the other side of the table. If the buyer is gaining less than the print suggests, the developer is realising less than the print suggests too.
Economists have a name for treating a printed figure as a real one. Money illusion — the habit of reading a nominal number as though it were a true one. It usually describes a household mistaking a pay rise for an actual gain in purchasing power. It describes Mumbai feasibility models just as well in 2026. Thirty-two thousand is the nominal number. What lands in the account is the real one. Almost every model in this city still runs on the first.
The Stock Is Piling Up Exactly Where Everyone Went
The second half of the problem is where the unsold homes are sitting. Cheaper stock got scarcer this year. Expensive stock did not.
According to Knight Frank’s H1 2026 data:
- Unsold inventory in the sub-₹50 lakh segment declined 7% year-on-year
- Unsold inventory in the ₹50 lakh–₹1 crore segment fell 3%
- Unsold inventory in the ₹1–2 crore segment rose 12%
- Unsold inventory in the ₹2–5 crore segment surged 43% to 65,671 units
- Unsold inventory in the ₹5–10 crore segment rose 23%

That is not a demand signal. It is a supply signal. It marks the price band that every developer walked into at the same time — and it is precisely the band where you will end up paying for volume with incentives rather than with price.
One Plot, Three Entirely Ordinary Events
The following is an illustrative scenario using directional assumptions consistent with published Mumbai market data. It is not an observed project.
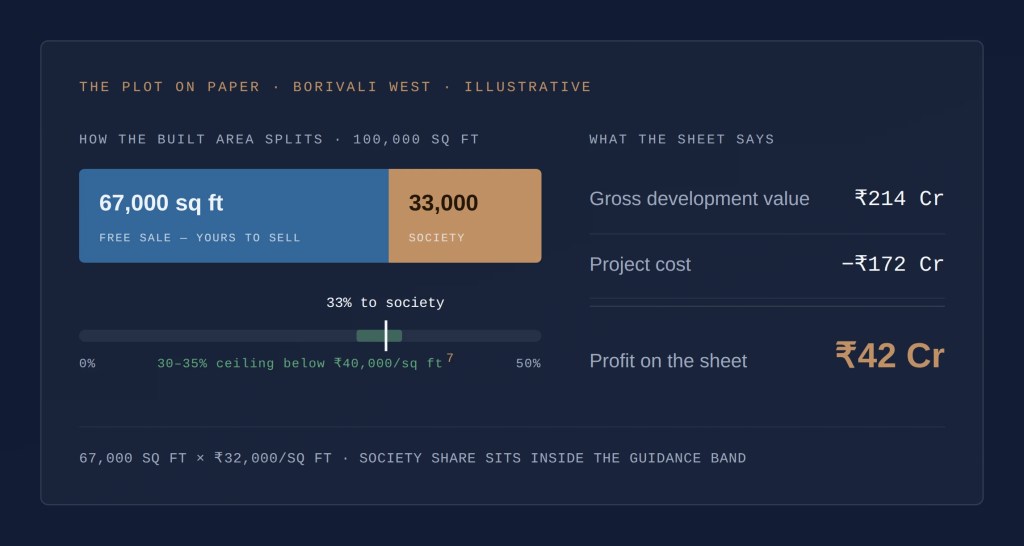
Take a society redevelopment in Borivali West. This is the deal as it sits on the sheet the day you sign it.
| Parameter | Assumption |
| Saleable area | 1,00,000 sq.ft. |
| Launch price | |
| Gross revenue (paper) | ₹214 crore |
| Total project cost | ₹172 crore |
| Society rehab share | 33% of saleable area |
| Paper profit | ₹42 crore |
Now let three entirely unremarkable things happen — no litigation, no collapse, nothing you would call a crisis.
| Scenario | What happens | IRR / profit impact |
| Base case | Everything as modelled | ₹42 crore profit, ~22% IRR |
| Effective realisation is ₹30,000 psf (not ₹32,000) | Stamp duty absorbed, floor rise waived, enhanced channel partner commission | Revenue falls ₹13 crore → profit ₹29 crore |
| Sales run at 19-month velocity (Mumbai’s current QTS) vs 12-month assumption | Interest carry on unsold inventory for 7 additional months | Adds ₹8–10 crore cost → profit ₹19–21 crore |
| Approval delay of 6 months | Rent, interest carry, cost escalation (as modelled in Archonet's approval delay analysis) | Adds ₹6–8 crore cost → profit ₹11–15 crore |
Three unremarkable events. ₹42 crore becomes ₹11–15 crore — roughly one third the margin, without a single dramatic failure.

And something else moved that nobody re-ran. That 33% area share is now materially higher relative to effective revenue. The society negotiation on the next project will be harder.

The Question That Belongs on the First Page
Every feasibility in this city answers the same question: what can I sell this at?
Very few answer the two that actually decide whether the project survives:
What reaches me — after incentives, after commissions, after the concessions that don’t appear in any price index?
How long does it take to get here — given current absorption velocity, approval timelines, and real sales pace?
Notice that none of the three scenarios above required the market to fall. The headline rate is ₹32,000 in every one of them.
What the Model Still Cannot See
None of this is an argument for trusting a spreadsheet over a person who has been doing this for thirty years.
A model cannot tell you which secretary can genuinely hold 51% together through a monsoon. It cannot tell you that the plot owner next door will amalgamate if approached before his daughter’s wedding and not after. It cannot read a ward office, or a family, or the difference between a society that wants to move and one that only wants to be courted. Those judgments are why some firms in this city compound for three generations and others do not, and nothing in software is close to replacing them.
There are also pockets where the old instinct is simply correct — where stock is genuinely scarce and the headline holds all the way to handover. They exist. There are fewer of them than there were in 2023, and the useful discipline is being able to show that you are standing in one.
Feasibility Is a Range, Not a Number — And This Is How to Use It
The change is small and it is mostly a change of habit. Stop asking the model for a number. Ask it for the point at which the project breaks, and then ask how far you are standing from that point today.
The developer in Borivali still has the sharpest price instinct in the room. He knew the rate on that lane before anyone else, and he did not need a model to find it. What he needs is a second number sitting next to the first one: the one that says what actually reaches him — net of incentives, net of timeline, net of the three unremarkable things that happen on every project — and when.
That second number is what protects the first one.
How LandWise and FinWise Address the Realisation Gap
LandWise — Regulatory clarity before the sheet is built Before any revenue assumption is made, the regulatory reality of the site needs to be established: applicable FSI under DCPR 2034, scheme selection and its implications for society share, setbacks that affect saleable efficiency, and the approval cost stack. A feasibility built on the wrong scheme or an optimistic FSI assumption widens the realisation gap before a single concession is offered.
FinWise — Financial stress-testing across realistic scenarios FinWise models the project across multiple scenarios — effective realisation at ₹30,000 vs ₹32,000, sales velocity at 12 months vs 19 months, approval delay of 3, 6, or 9 months — and shows you the point at which IRR crosses below your minimum threshold. The output is not one number. It is a range, with a clearly marked break-even and the distance you are currently standing from it.
The gap between a well-modelled project and an optimistic one is not usually visible on the day you sign. It surfaces in month 18, when the rent cheque is the nineteenth one.
Explore LandWise → | Stress-test your realisation in FinWise →
Sources: Knight Frank India, India Real Estate H1 2026 Report (July 2026) · Knight Frank India, India Real Estate H1 2026 Residential Market Update (July 2026) · Knight Frank India H1 2026 unsold inventory data as reported by ANI/Realty Quarter (August 2026) · RBI Monetary Policy Committee decisions, December 2025 and June 2026 · JLL India Residential Dynamics Report Q1 2026. The illustrative scenario is a worked composite at stated assumptions, not an observed project. All figures directional; run your own deal-level feasibility before committing capital.