

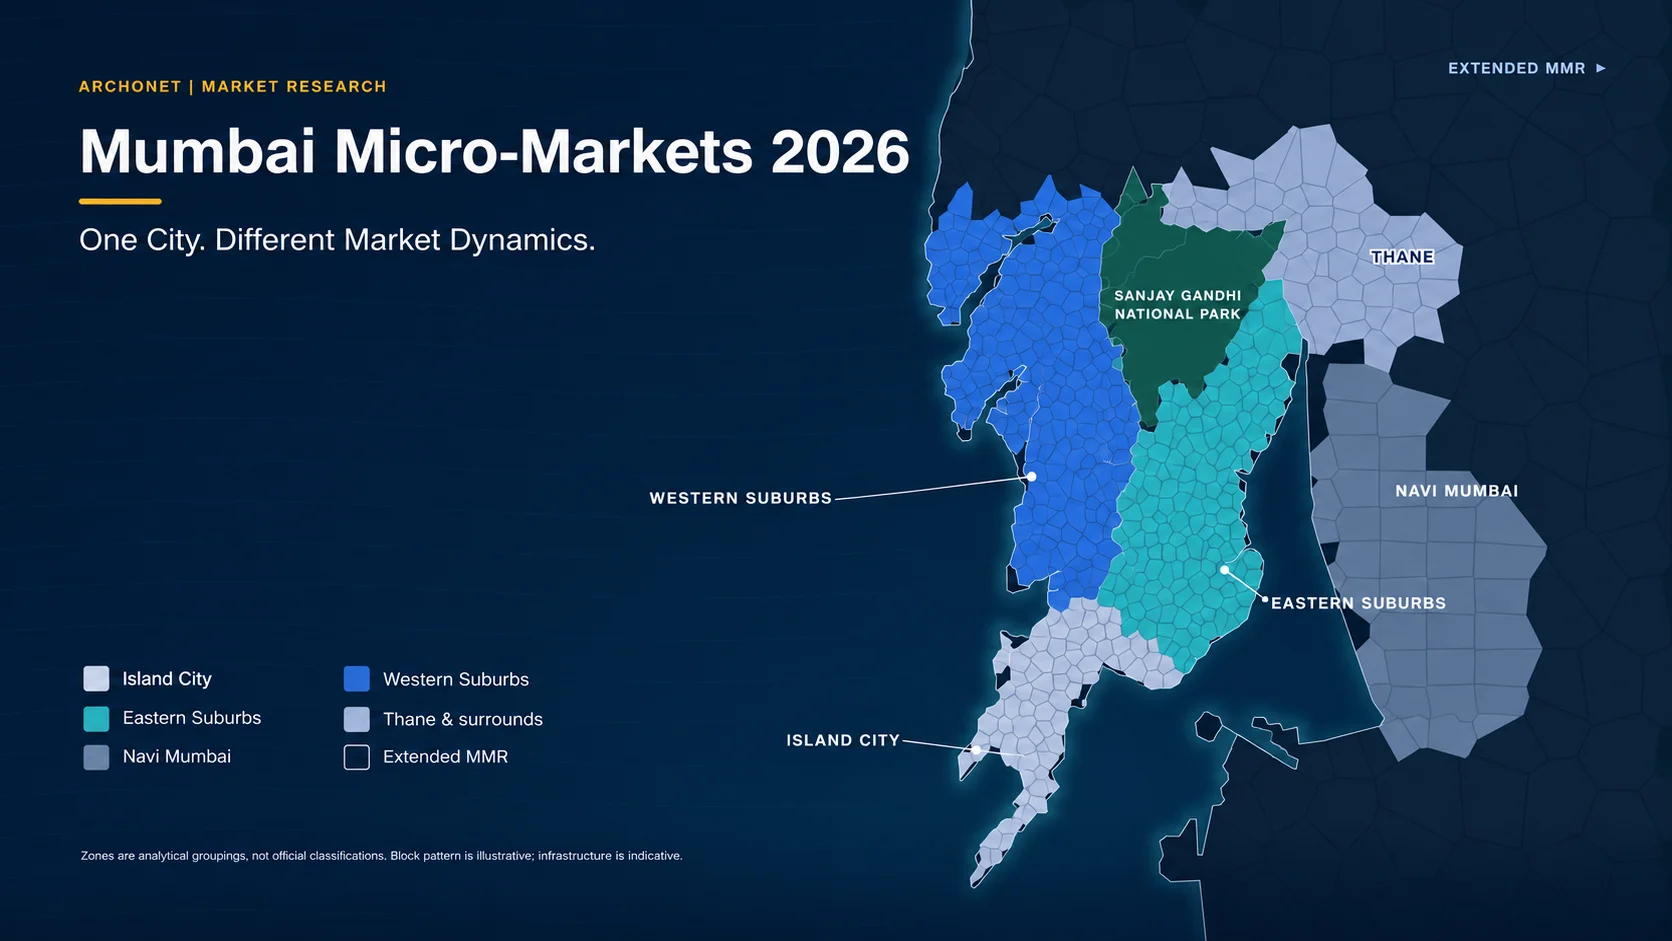
Ask ten people about the Mumbai property market and you will get ten different answers. That is because there is no single market. There are dozens of Mumbai micro – markets, and a Lower Parel penthouse, a Ghatkopar redevelopment flat and a Panvel launch near the new airport have different buyers, different price logic and different risk profiles.
For developers, investors and builders, the gap between a successful project and a stalled one often comes down to how well they read these micro- markets. This guide uses Q3 2026 data from ANAROCK and Cushman & Wakefield to show where prices, rents and launches are moving, and where the risks sit.
Table of Contents
What Is a Mumbai Micro Market and Why Does It Matter?
A Mumbai micro- market is a very local area whose pricing, demand, absorption rate and growth drivers do not follow the rest of the city.
Andheri East and Andheri West share a name but not a story. One is defined by offices and the airport, the other by lifestyle and legacy neighbourhoods.
Think of two buyers with the same budget. One buys at a metro station with a job hub 25 minutes away. The other buys in a pocket with no transit connection and high inventory. Five years on, they own very different assets, and the city average tells you nothing about either.
The Mumbai Property Market in Q3 2026: Sales Rebound, Supply Runs Ahead
According to ANAROCK’s Q3 2026 data, the Mumbai Metropolitan Region (MMR) remains India’s largest housing market, with about 32% of sales and 33% of new launches across the Top 7 cities.
| MMR, Q3 2026 | Figure | Change |
| New launches | ~37,500 units | +27% YoY, +9% QoQ |
| Sales | ~31,750 units | +5% YoY, +11% QoQ |
| Available inventory | ~1,98,050 units | +12% YoY |
| Average price (super built – up area) | ₹17,950 per sq ft | +4% YoY |
| Inventory overhang | 19 months | Up 9% YoY |
Source: ANAROCK Research & Advisory, Q3 2026
Launches grew about five times faster than sales year on year, so supply is still racing ahead of demand. ANAROCK warns that if launches keep outpacing absorption, rising inventory could hold back price growth in inventory heavy markets, MMR among them.
Two other signals matter:
• Demand is end – user led. Sales grew despite rising prices.
• Developers are moving down the price curve. In MMR, affordable and lower – mid homes (below ₹80 lakh) rose to 51% of launches, from 39% a quarter earlier.
Cushman & Wakefield’s Q3 view of Mumbai points the same way:
• Registrations hit 12,622 in September 2026, up 5% year – on – year and the highest September in 14 years.
• C&W recorded 17,837 launches, down 17% quarter – on – quarter but up 16% year – on – year.
• Mid – segment homes (₹1 – 3 crore) made up about 40% of launches.
• The weighted average capital value for newly launched projects was ₹23,600 per sq ft, down 7% quarter – on – quarter as fewer premium projects launched.

Mumbai Micro – Markets to Watch in 2026
Submarkets and data follow Cushman & Wakefield’s Q3 2026 classification, collected up to 11 September 2026. Capital values are quoted base rates, which exclude PLC, EDC and IDC charges, so they are not comparable with ANAROCK’s per – sq – ft figure above.

Thane (Thane West, Ghodbunder Road, Pokhran Road)
Thane works as an integrated urban centre, with high – rises, wide roads and metro and transit upgrades on the way. C&W names Ghodbunder Road as a key contributor to Q3 mid – segment supply.
• By the numbers: Mid – segment capital values run ₹12,000 – 23,000 per sq ft, flat quarter – on – quarter but up 7% year – on – year, the fastest annual growth of any tracked submarket.
• Rents: ₹20,100 – 38,000 a month (+3% YoY).
• Launches: 2,301 units, or 13% of Q3 supply.
• Drivers: Metro Line 4, still under construction and phased through 2026 – 27, and the Eastern Express Highway.
• Best for: Mid – segment developers and investors who want infrastructure – led growth at a lower entry price.
• Watch – out: Metro timelines, and competition from Navi Mumbai in the same mid – segment.
Navi Mumbai and Panvel (Vashi, Belapur, Kharghar, Panvel)
Navi Mumbai is propelled by the Mumbai Trans Harbour Link (Atal Setu) and the Navi Mumbai International Airport, which began commercial operations on 25 December 2025. It led Mumbai’s Q3 launches with a 31% share. C&W names Panvel as the key contributor, citing expectations around the Mumbai 3.0 development, and precincts around the airport were also key contributors to mid – segment supply.
• By the numbers: Capital values run ₹9,000 – 24,000 per sq ft, up 2% quarter – on – quarter (the fastest of any submarket) and 6% year – on – year.
• Rents: ₹15,600 – 70,000 a month (+4% YoY).
• Key Q3 launch: Tata Orbis Phase I in Ghansoli, with 506 units of 750 – 1,060 sq ft.
• Drivers: Atal Setu and the new airport.
• Best for: Affordable to mid – range launches and early – stage land plays near the airport.
• Watch – out: There is still no direct metro to the airport, and Navi Mumbai and Thane together supplied over 65% of mid – segment launches, so competition is heavy.
Goregaon and Malad
A primary magnet in the western suburbs for corporate workers and end – users. Commercial office parks and lifestyle infrastructure support steady demand along the Western Express Highway. C&W notes that redevelopment in the Western Suburbs gave key support to Q3 supply, and that rising rental demand there is driving rents.
• By the numbers: C&W’s Western Suburbs mid – segment, which spans Andheri to Dahisar, shows capital values of ₹18,000 – 34,500 per sq ft (+1% QoQ, +5% YoY).
• Rents: ₹27,000 – 1,12,000 a month (+3% YoY).
• Launches: 3,356 units, or 19% of Q3 supply.
• Key Q3 launch: L&T Ahana in Malad, with 317 units of 818 – 2,311 sq ft.
• Drivers: Western Express Highway and commercial office parks.
• Best for: Mid – segment to luxury launches aimed at working professionals.
• Watch – out: Congestion, and rising supply in the belt.
Wadala and Central Mumbai
Close to business districts like Lower Parel and BKC, Wadala is seeing redevelopment and new high – rise activity. C&W places Wadala in its Eastern Suburbs submarket, along with Sion, Kurla and Chembur. Metro Line 2B’s first section opened in April 2026, and Line 4 will start at Wadala.
• By the numbers: Eastern Suburbs capital values run ₹16,500 – 33,500 per sq ft in the mid – segment (+5% YoY) and ₹22,000 – 75,000 in the high – end segment (+4% YoY).
• Launches: 2,151 units, or 12% of Q3 supply.
• Key Q3 completion: Purva Clermont in Chembur, with 237 units.
• Drivers: Metro Line 2B (open), Metro Line 4 (upcoming) and redevelopment.
• Best for: Luxury and redevelopment – led developers.
• Watch – out: Tight sites and approvals that take time.
Mulund, Bhandup and Kanjurmarg
These central – eastern suburbs sit close to Powai’s employment hubs, with competitive pricing and steady appreciation, helped by eastern connectivity routes like the JVLR. C&W includes them in the Eastern Suburbs mid – segment.
• By the numbers: Capital values run ₹16,500 – 33,500 per sq ft (+5% YoY).
• Rents: ₹25,800 – 92,500 a month. Rent growth was only +1% YoY, the softest of the tracked submarkets.
• Drivers: Proximity to Powai hubs, JVLR and eastern connectivity.
• Best for: Mid – segment buyers who want proximity to Powai jobs.
• Watch – out: Capital appreciation is healthy, but rental growth is slow.
Borivali and Kandivali
Well – connected northern western suburbs with family – oriented social infrastructure and continuous absorption of residential inventory. C&W lists Kandivali, Borivali and Dahisar in the same Western Suburbs mid – segment as Goregaon – Malad, so the same figures apply.
• By the numbers: Capital values of ₹18,000 – 34,500 per sq ft (+5% YoY), with rents up 3%.
• Drivers: Western Express Highway, metro and social infrastructure.
• Best for: Mid – segment and mid – premium launches.
• Watch – out: Price – conscious buyers, so pricing discipline is essential.
Worli, Prabhadevi and Bandra (South and South Central Mumbai)
The premier luxury zone: limited supply, sea – facing high – rises and upscale redevelopment. C&W splits the area into three submarkets. Worli and Prabhadevi sit in South Central, Bandra sits in Western Suburbs – Prime, and Colaba to Malabar Hill sits in South.
• South Central (Worli, Prabhadevi): ₹34,000 – 92,000 per sq ft (+4% YoY), rents ₹82,000 – 6,50,000.
• Western Suburbs – Prime (Bandra): ₹31,000 – 78,000 per sq ft (+5% YoY), rents ₹85,000 – 9,97,000.
• South (Colaba to Malabar Hill): ₹52,700 – 1,06,000 per sq ft (+3% YoY).
• Prime CBD assets: ₹65,000 – 1,10,000 per sq ft, per C&W.
• Key Q3 completion: Sugee Marina Bay in Worli, with 83 units of 1,817 – 3,692 sq ft.
• Launch mix: High – end and luxury homes made up about 22% of Q3 launches, and premium launches fell about 11% quarter – on – quarter.
• Drivers: Limited supply and upscale redevelopment.
• Best for: Luxury and ultra – luxury developers and long – horizon investors.
• Watch – out: Very high entry cost and a narrow buyer pool. Growth here is steady, not spectacular.
Looking to turn this data into a land or redevelopment decision? Talk to the Archonet team about micro – market intelligence for your next site. [CTA button: Talk to Archonet]
Mumbai Micro – Markets at a Glance
| Micro – market | Primary appeal | Market segment | Key growth drivers |
| Thane | Integrated city living | Mid – segment (C&W data shows ₹12,000 – 23,000 per sq ft) | Upcoming Metro Line 4, Eastern Express Highway |
| Navi Mumbai & Panvel | Planned infrastructure, airport proximity | Affordable to mid-range | Navi Mumbai International Airport (operational), Atal Setu |
| Goregaon – Malad | Work – life balance, commercial proximity | Mid to luxury | Western Express Highway, commercial parks |
| Wadala – Central Mumbai | Access to Lower Parel and BKC | Luxury and redevelopment | Metro Line 4 (upcoming), Line 2B, civic projects |
| Mulund – Kanjurmarg | Proximity to Powai hubs | Mid – segment | JVLR and eastern connectivity |
| Borivali – Kandivali | Family – oriented, high absorption | Mid to mid – premium | Western Express Highway, metro, social infrastructure |
| Worli – Bandra – Prabhadevi | Coastal lifestyle, scarcity | Luxury and ultra – luxury | Limited supply, upscale redevelopment |
Mumbai Property Prices by Submarket: Q3 2026 Data Snapshot
| Submarket | Avg quoted capital value (₹/sq ft) | QoQ | YoY | Avg quoted rent (₹/month) | Rent YoY |
| High – end segment | |||||
| South | 52,700 – 1,06,000 | 0% | +3% | 80,000 – 7,60,000 | +4% |
| South Central | 34,000 – 92,000 | +1% | +4% | 82,000 – 6,50,000 | +2% |
| Eastern Suburbs | 22,000 – 75,000 | +1% | +4% | 45,000 – 4,60,000 | +3% |
| Western Suburbs – Prime | 31,000 – 78,000 | +1% | +5% | 85,000 – 9,97,000 | +2% |
| Mid – segment | |||||
| Eastern Suburbs | 16,500 – 33,500 | +1% | +5% | 25,800 – 92,500 | +1% |
| Western Suburbs | 18,000 – 34,500 | +1% | +5% | 27,000 – 1,12,000 | +3% |
| Thane | 12,000 – 23,000 | 0% | +7% | 20,100 – 38,000 | +3% |
| Navi Mumbai | 9,000 – 24,000 | +2% | +6% | 15,600 – 70,000 | +4% |
Source: Cushman & Wakefield MarketBeat, Mumbai Residential Q3 2026
Rents rose 1% quarter – on – quarter in every submarket. Segments: mid ₹1 – 3 crore, high – end ₹3 – 6 crore.
Share of Q3 launches (17,837 units): Navi Mumbai 31%, Western Suburbs 19% (3,356 units), Thane 13% (2,301), Eastern Suburbs 12% (2,151).
[img 3: ALT TEXT : Thane led Mumbai submarkets with 7% year-on-year capital value growth in Q3 2026, ahead of Navi Mumbai at 6%.Year-on-year growth in quoted capital values across Mumbai submarkets, Q3 2026. Infrastructure-led, lower-priced submarkets grew fastest, while South Mumbai grew 3%.]
The Infrastructure Effect: How Mumbai’s Travel Times Are Being Rewritten
In real estate, travel time matters more than straight – line distance, and Mumbai is rewriting its travel times.
• Atal Setu (MTHL): This 21.8 – km sea bridge links Chirle in Navi Mumbai with Sewri in Mumbai and cuts travel time to South Mumbai significantly.
• Navi Mumbai International Airport: Operating since December 2025, it connects to Atal Setu and the Sion – Panvel Highway. A direct metro link is still to come.
• Metro expansion: Line 2B’s first section is open, with further sections and Line 4 following through 2026 – 27. Each new station creates a fresh buyer catchment.
• Mumbai 3.0: In February 2026 the cabinet approved a land acquisition and allotment policy, and about 200 sq km was handed to MMRDA.
The pattern repeats: infrastructure is announced, early movers enter, the project goes live and the micro – market re – prices. The biggest gains usually come before the ribbon cutting.
Redevelopment: Mumbai’s Quiet Growth Engine
With the sea on three sides, Mumbai builds upwards and builds again. Take a housing society in the eastern suburbs, built in the early 1970s: 40 units, outdated plumbing, a leaking terrace. Redeveloped into a modern tower, its members get bigger homes and the developer gets inventory to sell.
Multiply that across thousands of societies and you get a steady pipeline of brownfield opportunities. C&W notes that smaller redevelopment projects made up a greater share of Q3 supply. These projects reward developers who have community trust, clean execution and a real understanding of what residents want.
Before bidding, know the rules that apply to each site, starting with our DCPR 2034 guide, and run the numbers using Finwise.For how deals are typically structured, see our guide to [redevelopment deal structures between societies and developers].
What Mumbai Micro – Markets Mean for Each Stakeholder
Developers: Match product to micro – market, and pace launches to realised sales rather than last quarter’s momentum. Mid – segment homes took about 40% of Q3 launches, and Navi Mumbai and Thane supplied over 65% of them, so that is where competition is most intense. Execution track record is weighing more heavily on buyer decisions than in earlier cycles.
Investors: Look past the city – wide average. Capital value growth was strongest in infrastructure – led, lower – priced submarkets: Thane +7%, Navi Mumbai +6%, mid – segment suburbs +5%, against +3% in the South. Rent growth ran at 1 – 4%. Screen every site before you commit with our five-layer land feasibility screen
Business development heads: Build your land and redevelopment pipeline along infrastructure corridors, and start conversations early. The best deals are often negotiated years before launch.
Construction teams: Every new corridor brings sustained demand for contractors, materials and skilled labour. Brownfield sites with tight access and neighbouring buildings reward teams that plan logistics carefully.
A Word of Caution Before You Invest in Mumbai Micro – Markets
Not every micro – market will deliver. With 19 months of overhang and inventory up 12% year – on – year, weaker projects will take longer to sell, and infrastructure timelines can slip.
Headline averages can also mislead. C&W’s weighted average capital value for new launches rose 20% year – on – year yet like – for – like submarket values rose 3 – 7%, because launch mix shifts the average.
Data also varies by provider. ANAROCK covers all of MMR (about 37,500 Q3 launches) while C&W tracks a narrower Mumbai market (17,837), and PropEquity’s Q3 sales figures for Mumbai and Thane differ again. Always check the source and method and remember that a benchmark rate is not what a project realises.
The Bottom Line
Mumbai’s growth story is no longer about one hot address. It is about dozens of Mumbai micro – markets moving on different timelines, and the advantage goes to those who read the map at street level.
Two buyers started with the same budget and ended up with very different assets. The difference was not luck. It was how closely each one looked.
Don’t let the city average make the call. Use LandWise to check what a site can legally support, and FinWise to test whether the numbers work.
Key Takeaways
Supply is outrunning demand. MMR launches rose 27% year-on-year while sales rose 5%, leaving 19 months of inventory overhang.
Price growth is strongest in infrastructure-led, lower-priced submarkets. Thane (+7%) and Navi Mumbai (+6%) led, against +3% in South Mumbai.
Developers are moving down the price curve. Homes below ₹80 lakh made up 51% of MMR launches in Q3, up from 39% a quarter earlier.
Competition is heaviest in the mid-segment. Navi Mumbai and Thane together supplied over 65% of mid-segment launches.
Check the source. ANAROCK and C&W cover different geographies, so their figures are not directly comparable.
Which Mumbai micro-market has the highest price growth in 2026?
In C&W’s Q3 2026 data, Thane’s mid-segment recorded the fastest annual capital value growth of any tracked submarket, at +7% year-on-year. Navi Mumbai followed at +6%.
Is Navi Mumbai a good investment after the airport opened?
Navi Mumbai has strong infrastructure drivers (Atal Setu and the Navi Mumbai International Airport, operating since 25 December 2025) and led Q3 launches with a 31% share. The trade-offs are heavy mid-segment competition and no direct metro to the airport yet.
Thane vs Navi Mumbai: which is better for investors?
Thane showed faster year-on-year growth (+7% vs +6%) at flat quarter-on-quarter values, while Navi Mumbai grew faster over the quarter (+2%) and has a wider, lower entry range (₹9,000-24,000 per sq ft vs ₹12,000-23,000). Both face competition in the same mid-segment, so the right choice depends on the specific project and timeline.
What are the best areas to invest in Mumbai in 2026?
There is no single best area. Thane and Navi Mumbai led on price growth, the Western and Eastern Suburbs mid-segment grew about 5%, and South Mumbai grew about 3% with higher entry costs. Match the micro-market to your budget, time horizon and risk appetite.
How many months of unsold inventory does Mumbai have?
ANAROCK puts MMR’s inventory overhang at 19 months in Q3 2026, up 9% year-on-year.
Why do Mumbai property price figures differ between reports?
ANAROCK reports average prices on a super built-up area basis for all of MMR, while C&W reports quoted base capital values for specific Mumbai submarkets, excluding PLC, EDC and IDC charges. The two are not directly comparable.
Glossary
• Absorption rate: The pace at which available homes are sold in a given period.
• Inventory overhang: The number of months it would take to sell current unsold inventory at the current sales pace.
• MMR: Mumbai Metropolitan Region.
• PLC: Preferential Location Charges, extra fees for premium locations within a project.
• EDC: External Development Charges, levied for external infrastructure.
• IDC: Infrastructure Development Charges, levied for infrastructure development.
• DCPR 2034: Mumbai’s Development Control and Promotion Regulations for 2034.
• MMRDA: Mumbai Metropolitan Region Development Authority.
• MTHL: Mumbai Trans Harbour Link (Atal Setu).